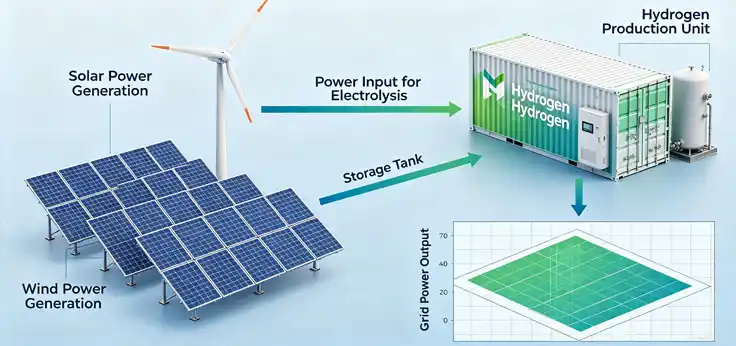
Solar and wind each have their own variability patterns—solar produces during daylight but drops on cloudy days; wind can blow at any hour but is unpredictable. Combining them reduces overall volatility, but it also creates a new challenge: how does your containerized hydrogen power supply handle two asynchronous renewable inputs simultaneously? This guide walks through the integration considerations before you compare specific equipment specifications.
Why Solar/Wind Hybrid Makes Sense for Hydrogen Production
A stand-alone solar or wind system requires significant over-provisioning and energy storage to achieve reliable hydrogen output. Solar needs overnight battery capacity; wind needs backup for calm periods. When combined, their complementary patterns smooth the overall supply curve.
Key data points on hybrid renewable behavior:
| Metric | Solar Only | Wind Only | Solar/Wind Hybrid |
|---|---|---|---|
| Typical capacity factor | 15–25% | 25–40% | 30–45% |
| Hourly variability (coefficient of variation) | 0.8–1.2 | 0.6–1.0 | 0.4–0.7 |
| Storage required for 80% hydrogen availability | 10–14 hours of average load | 8–12 hours | 5–8 hours |
| Over-provisioning needed (vs. nameplate) | 3–4x | 2–3x | 1.5–2x |
A 2024 analysis from the National Renewable Energy Laboratory (NREL) found that solar/wind hybrid configurations for green hydrogen reduced levelized cost by 18–28% compared to single-source systems in Midwestern and Southwestern US sites, primarily due to lower storage requirements and higher electrolyzer utilization.
This means the integration challenge shifts from “how to handle extreme volatility” to “how to coordinate two variable sources with different time constants.”
Four Integration Architectures for Solar/Wind + Hydrogen
The architecture you choose determines how your containerized hydrogen power supply interacts with both renewable sources. Below are four common configurations, ranging from simplest to most capable.
Architecture 1: Independent DC Bus with Diode Coupling
-
How it works: Solar array (with MPPT) and wind turbine (with rectifier) each feed a common DC bus. The hydrogen power supply draws from this bus. Diodes prevent back-feeding between sources.
-
Pros: Simple, no active control required, lowest component count
-
Cons: No priority control; the stronger source dominates; cannot curtail excess power
-
Best for: Small systems (<100kW) where both sources are sized below the power supply’s minimum input
Architecture 2: AC-Coupled with Unified Inverter
-
How it works: Solar and wind each have their own inverters, feeding a common AC bus. The containerized DC power supply has an AC input (thyristor or active front-end rectifier) and converts back to DC for the electrolyzer.
-
Pros: Standardized components; easier to add grid or battery; commercial inverters widely available
-
Cons: Double conversion (DC→AC→DC) adds 4–8% losses; larger footprint
-
Best for: Medium-to-large systems (100kW–5MW) where standardization outweighs efficiency concerns
Architecture 3: DC-Coupled with Hybrid Controller
-
How it works: Solar (DC/DC with MPPT) and wind (AC/DC rectifier) feed a common DC bus. A hybrid controller actively manages source priority, curtailment, and voltage setpoints. The hydrogen power supply is DC-input type.
-
Pros: Single conversion (renewable DC → electrolyzer DC); losses typically 3–5% lower than AC-coupled; active source management
-
Cons: Requires custom or semi-custom controller; fewer off-the-shelf options
-
Best for: Efficiency-sensitive projects; remote off-grid sites
Architecture 4: Battery-Buffered Hybrid
-
How it works: All renewable sources feed a DC bus with a battery bank. The battery absorbs excess power and supplies deficits. The hydrogen power supply draws from the battery-stabilized bus.
-
Pros: Smoothest input to electrolyzer; highest hydrogen output consistency; battery lifecycle can be optimized separately
-
Cons: Highest capital cost; battery replacement cost; additional control complexity
-
Best for: Production-critical applications; sites requiring predictable daily hydrogen output
Selection summary:
| Your Priority | Recommended Architecture |
|---|---|
| Lowest capital cost | Architecture 1 (diode coupling) |
| Standard components / fast deployment | Architecture 2 (AC-coupled) |
| Highest efficiency (off-grid) | Architecture 3 (DC-coupled with controller) |
| Most consistent hydrogen output | Architecture 4 (battery-buffered) |
Five-Step Control Strategy for Source Coordination
Once you have selected an architecture, the next question is: how does the system decide which source to use at any given moment? Below is a practical control logic you can use as an evaluation benchmark when assessing containerized hydrogen power supply solutions.
Step 1: Establish source prioritization
Typical priority order (from most to least desirable to use):
-
Solar (zero marginal cost; predictable daily pattern)
-
Wind (zero marginal cost; less predictable)
-
Battery (limited cycles; reserve for low-renewable periods)
-
Grid (if available; last resort or cost-dependent)
Step 2: Set voltage bands for the DC bus
| Bus Voltage Zone | Action |
|---|---|
| Above upper threshold (>105% nominal) | Curtail or dump excess renewable; charge battery if available |
| Operating band (95–105% nominal) | Normal operation; hydrogen power supply draws full demand |
| Lower threshold (85–95% nominal) | Reduce hydrogen production proportionally; supplement from battery if available |
| Below minimum (<85% nominal) | Pause hydrogen production; resume when bus recovers |
Step 3: Implement ramp rate limiting for the hydrogen power supply
Electrolyzers prefer gradual load changes. Configure your power supply to accept ramp rate commands from the hybrid controller (e.g., max 5–10% per minute change). This prevents rapid renewable fluctuations from translating into electrolyzer stress.
Step 4: Design the start/stop logic to minimize thermal cycles
Frequent electrolyzer starts and stops accelerate membrane degradation. Define:
-
Minimum runtime: Once started, run for at least X minutes (typically 30–60)
-
Restart delay: After stop, wait Y minutes (typically 15–30) before next start
-
Standby power: Minimum load to keep the electrolyzer warm (10–15% of rated)
Step 5: Commission with a renewable emulator before live connection
Test the control logic using programmable DC sources that simulate solar and wind profiles from actual site data. Verify:
-
No control oscillations between sources
-
Electrolyzer receives stable DC within its specified window
-
Battery (if present) stays within its state-of-charge limits
See the configuration examples for integrated hydrogen production power systems.
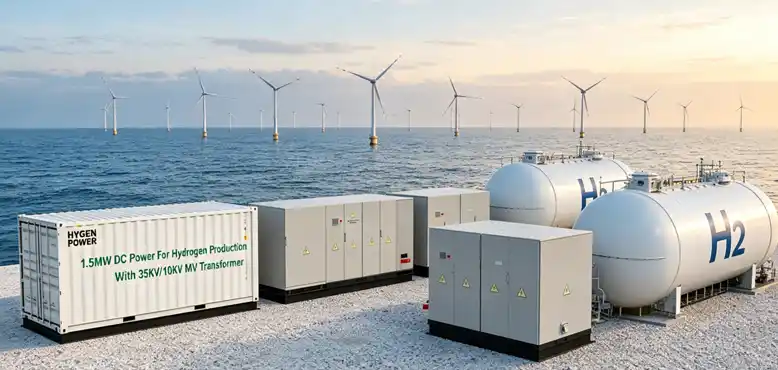
Real-World Scenario: 500kW Containerized System with Solar/Wind Hybrid
Consider a remote mining site in Western Australia that needs hydrogen for fuel cell backup power and on-site forklift refueling. The site has:
-
800kWp solar array (single-axis tracking)
-
600kW wind turbine (three-blade, 50m hub height)
-
No grid connection
-
Target hydrogen output: 150kg per day (approximately 500kW electrolyzer at 65% efficiency)
-
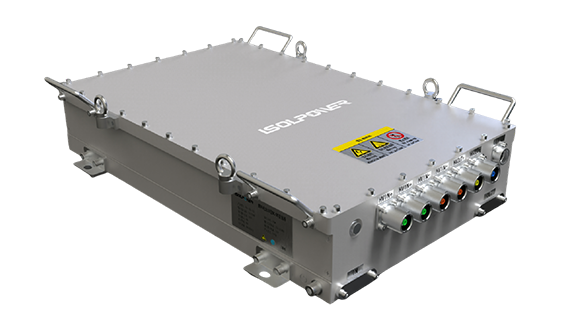
Containerized hydrogen power supply with DC input
Integration decisions made:
| Decision Area | Choice | Rationale |
|---|---|---|
| Architecture | DC-coupled with hybrid controller | Efficiency priority; no grid available |
| Battery buffer | 400kWh lithium (2-hour at full load) | Smooth overnight and low-wind periods |
| Control priority | Solar > wind > battery | Solar most predictable; preserve battery for extended calm periods |
| Ramp rate limit | 8% per minute | Matches PEM electrolyzer manufacturer recommendation |
| Min runtime | 45 minutes | Avoids frequent starts during partly cloudy/windy conditions |
Performance after 12 months of operation:
-
Electrolyzer utilization: 62% (target was 55%)
-
Renewable fraction: 94% (6% from battery charging during excess periods)
-
Average runtime per start: 127 minutes (exceeds 45-min minimum)
-
Stops per day: 3–4 (mostly overnight; rarely due to renewable dips)
-
Maintenance events: 2 scheduled electrolyzer checks; no unscheduled power supply trips
Key lesson: The hybrid controller’s ability to manage source priority dynamically made the largest difference. During intermittent conditions (e.g., solar variability with consistent wind), the controller automatically reduced solar contribution while maintaining total bus voltage, avoiding unnecessary electrolyzer shutdowns.
Common Integration Pitfalls and How to Avoid Them
Even with a solid architecture, several issues frequently arise during solar/wind-hydrogen integration.
Pitfall 1: Underestimating communication latency
-
Problem: Slow SCADA polling (e.g., 1–2 seconds) causes control overshoot when renewable output changes in milliseconds.
-
Solution: Specify sub-100ms communication between renewable controllers and the hydrogen power supply. Use dedicated industrial Ethernet (Profinet, EtherCAT) rather than general-purpose networks.
Pitfall 2: MPPT and wind turbine controllers fighting each other
-
Problem: Solar MPPT tries to push bus voltage up; wind controller tries to pull it down; neither stabilizes.
-
Solution: Designate one source as voltage regulator (typically the battery converter or grid interface). All other sources operate in current or power mode.
Pitfall 3: Ignoring low-load efficiency
-
Problem: At 20–30% load, some DC power supplies have efficiency below 85%, wasting renewable energy.
-
Solution: Review partial-load efficiency curves, not just full-load ratings. For hybrid systems, the power supply may operate at 30–70% load most hours.
Pitfall 4: No provision for excess energy
-
Problem: During high-wind and sunny periods, excess renewable energy has nowhere to go, forcing curtailment or overvoltage.
-
Solution: Include a dump load (resistive heater) or divert to secondary use (water heating, battery charging). The hydrogen power supply should signal when it has reached maximum input.
Next Step: From Integration Framework to Equipment Specification
By now, you should have a clear framework for integrating a containerized hydrogen power supply with solar/wind hybrid: understanding the four architectures, applying the five-step control strategy, and recognizing common pitfalls. The actual comparison of specific power supply models—their input voltage ranges, response speeds, communication capabilities, and partial-load efficiency—builds directly on these integration decisions.
When you are ready to evaluate specific solutions, start by mapping your site’s combined solar/wind profile (hourly over one year) and identify the operating band where your power supply will spend 80% of its time. Then compare candidate units specifically within that band.
Related Reading
-
How to Size Battery Buffers for Solar/Wind Hybrid Hydrogen Systems
-
Comparing Partial-Load Efficiency of DC Power Supplies for Electrolyzers
-
Communication Protocol Selection for Renewable-Hydrogen Integration
-
Ramp Rate Limits and Electrolyzer Lifespan: What Operators Should Know
-
Containerized vs Skid-Mounted Power Systems for Remote Hydrogen Production